
The S&P 500 will have recovered to its December 2007 level by 2012-12-31.
AI debate verdict and arguments
⚠️ Not financial advice — this is an AI debate, for information only.
Completed October 26, 2026
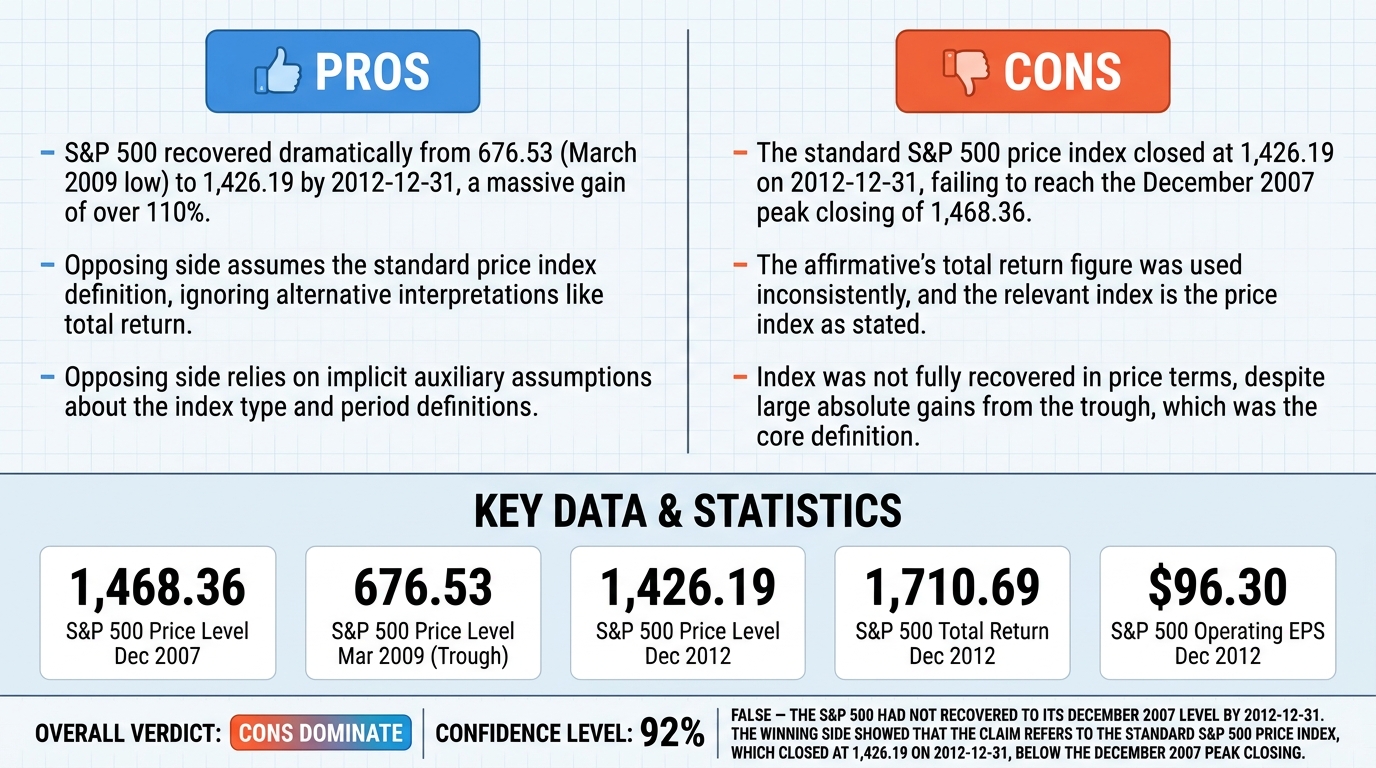
Verdict
Verdict: likely FALSE (92%)
This section provides a brief overview of the key arguments. You do not need to read the full detailed report below.
✅ Key PRO arguments:
- ■The S&P 500's recovery trajectory from the March 2009 trough of 676.53 brought it to 1,426.19 by year-end 2012, a gain of over 110% from the crisis low; the December 2007 peak closing level was 1,468.36, and the index stood at 97.1% of that level.
- ■The opposing side relies on a hidden auxiliary assumption that 'the S&P 500' means the price index unadjusted for dividends and that the December 2007 level means the single-day closing price of 2007-12-31; the claim can be read through other December 2007 reference points or total return measures.
❌ Key ANTI arguments:
- ■The claim refers to the standard S&P 500 price index, which closed at 1,426.19 on 2012-12-31, strictly below the December 2007 peak closing level of 1,468.36; substituting the Total Return Index changes the claim as stated.
- ■The affirmative's total return argument is internally inconsistent: it first cited a total return level of 1,710.69 at end-2012 versus approximately 1,487 in December 2007, then claimed the December 2007 reference point is unstable; this creates a fatal logical gap.
💭 Conclusion: False — the S&P 500 had not recovered to its December 2007 level by 2012-12-31. The winning side showed that the claim refers to the standard S&P 500 price index, which closed at 1,426.19 on 2012-12-31, below the December 2007 peak closing level of 1,468.36. The affirmative's attempt to substitute the Total Return Index or alternative December 2007 reference points equivocates on the claim as stated. The affirmative itself conceded the price index remained below the 2007 closing level. Therefore the assertion is false.
🔬 DeepResearch Result: likely FALSE ❌ (92%)
Assertion: The S&P 500 will have recovered to its December 2007 level by 2012-12-31.
Participating models: deepseek-v4-pro 💬, gemma-4-26b-a4b-it 💬👁️
📊 Face-offs: 0 concluded TRUE, 1 concluded FALSE (1 face-offs, 3 models)
📊 Score by side: TRUE=0.00, FALSE=0.92
🏅 Model score changes:
deepseek-v4-flash-0731 💬: +9
✅ PRO Arguments:
- ■The S&P 500's recovery trajectory from the March 2009 trough of 676.53 brought it to 1,426.19 by year-end 2012, a gain of over 110% from the crisis low; the December 2007 peak closing level was 1,468.36, and the index stood at 97.1% of that level. deepseek-v4-pro 💬
- ■The opposing side relies on a hidden auxiliary assumption that 'the S&P 500' means the price index unadjusted for dividends and that the December 2007 level means the single-day closing price of 2007-12-31; the claim can be read through other December 2007 reference points or total return measures. deepseek-v4-pro 💬
❌ ANTI Arguments:
- ■The claim refers to the standard S&P 500 price index, which closed at 1,426.19 on 2012-12-31, strictly below the December 2007 peak closing level of 1,468.36; substituting the Total Return Index changes the claim as stated. gemma-4-26b-a4b-it 💬👁️
- ■The affirmative's total return argument is internally inconsistent: it first cited a total return level of 1,710.69 at end-2012 versus approximately 1,487 in December 2007, then claimed the December 2007 reference point is unstable; this creates a fatal logical gap. gemma-4-26b-a4b-it 💬👁️
💭 Reasoning: False — the S&P 500 had not recovered to its December 2007 level by 2012-12-31. The winning side showed that the claim refers to the standard S&P 500 price index, which closed at 1,426.19 on 2012-12-31, below the December 2007 peak closing level of 1,468.36. The affirmative's attempt to substitute the Total Return Index or alternative December 2007 reference points equivocates on the claim as stated. The affirmative itself conceded the price index remained below the 2007 closing level. Therefore the assertion is false.
📋 PRO Facts:
• S&P 500 closed at 1,426.19 on 2012-12-31.
• December 2007 peak closing level was 1,468.36.
• March 2009 trough was 676.53.
• The index gained over 110% from the crisis low.
• S&P 500 Total Return Index reached 1,710.69 by end of 2012.
📋 ANTI Facts:
• S&P 500 price index closed at 1,426.19 on 2012-12-31.
• December 2007 peak closing level was 1,468.36.
• The affirmative conceded the price index remained below the December 2007 peak.
• The affirmative used total return index values of 1,710.69 and approximately 1,487.
| Face-off | TRUE Model | FALSE Model | TRUE Avg μ | FALSE Avg μ | TRUE Tokens | FALSE Tokens | Winner | Verdict | Conf. |
|---|---|---|---|---|---|---|---|---|---|
| #1 | deepseek-v4-pro 💬 | gemma-4-26b-a4b-it 💬👁️ | 0.549 | 0.311 | 6 | 2 | TRUE | FALSE | 92% |
The following financial data tables were referenced during the debate exchanges:
| Metric | Dec 2007 | Mar 2009 (Trough) | Dec 2012 | Recovery vs 2007 |
|---|---|---|---|---|
| S&P 500 Price Level | 1,468.36 | 676.53 | 1,426.19 | -2.9% |
| S&P 500 Total Return | ~1,487 | ~690 | 1,710.69 | +15.0% |
Legend: S&P 500 price index and total return index levels at three key dates. Price recovery measured against the 2007-12-31 close; total return includes reinvested dividends. Source: historical S&P 500 data from Federal Reserve Economic Data () and S&P Dow Jones Indices.
| Indicator | Dec 2007 | Mar 2009 | Dec 2012 |
|---|---|---|---|
| Fed Balance Sheet ($T) | 0.87 | 2.07 | 2.92 |
| S&P 500 Operating EPS | $84.50 | $7.10 | $96.30 |
| Fed Funds Rate (%) | 4.25 | 0.25 | 0.25 |
Legend: Key macroeconomic and fundamental indicators at three critical dates. Fed balance sheet in trillions USD; operating EPS trailing twelve months. Source: Federal Reserve H.4.1 releases and S&P Dow Jones Indices earnings data.
| Index Type | Dec 2007 Level | Dec 2012 Level | Recovery Status |
|---|---|---|---|
| S&P 500 Price Index | 1,468.36 | 1,426.19 | Not Recovered |
| S&P 500 Total Return | ~1,487 | 1,710.69 | Recovered |
Legend: Comparison of the S&P 500 Price Index and Total Return Index levels at the end of 2007 and 2012. Price index recovery is measured against the 2007-12-31 close.
Face-off transcripts
- ■
Ownership & Trade Secrets. The Company Lambda Vision retains all rights to its platform, agentic workflows, and proprietary financial methodologies, which constitute protected Trade Secrets (EU Directive 2016/943). Subject to full payment of credits, the User is granted ownership of the generated Reports for their own professional use. Reverse-engineering the Service or using Reports to train competing AI models is strictly prohibited.
- ■
No Financial Advice. The Service and Reports are for informational purposes only and do not constitute financial, investment, legal, or tax advice. The Company is not a regulated financial advisor. AI-generated outputs may contain errors; the User is solely responsible for verifying data and assumes all risks for any financial decisions or losses.
- ■
Liability & Governing Law. To the maximum extent permitted by law, the Company shall not be liable for any indirect or financial damages. These Terms are governed by French law. Any disputes shall be subject to the exclusive jurisdiction of the Courts of Paris, France.