
The advertising revenue outlook for the streaming company will exceed $2.7 billion for Q4 2026, despite management's revised guidance.
AI debate verdict and arguments
⚠️ Not financial advice — this is an AI debate, for information only.
Completed October 25, 2026
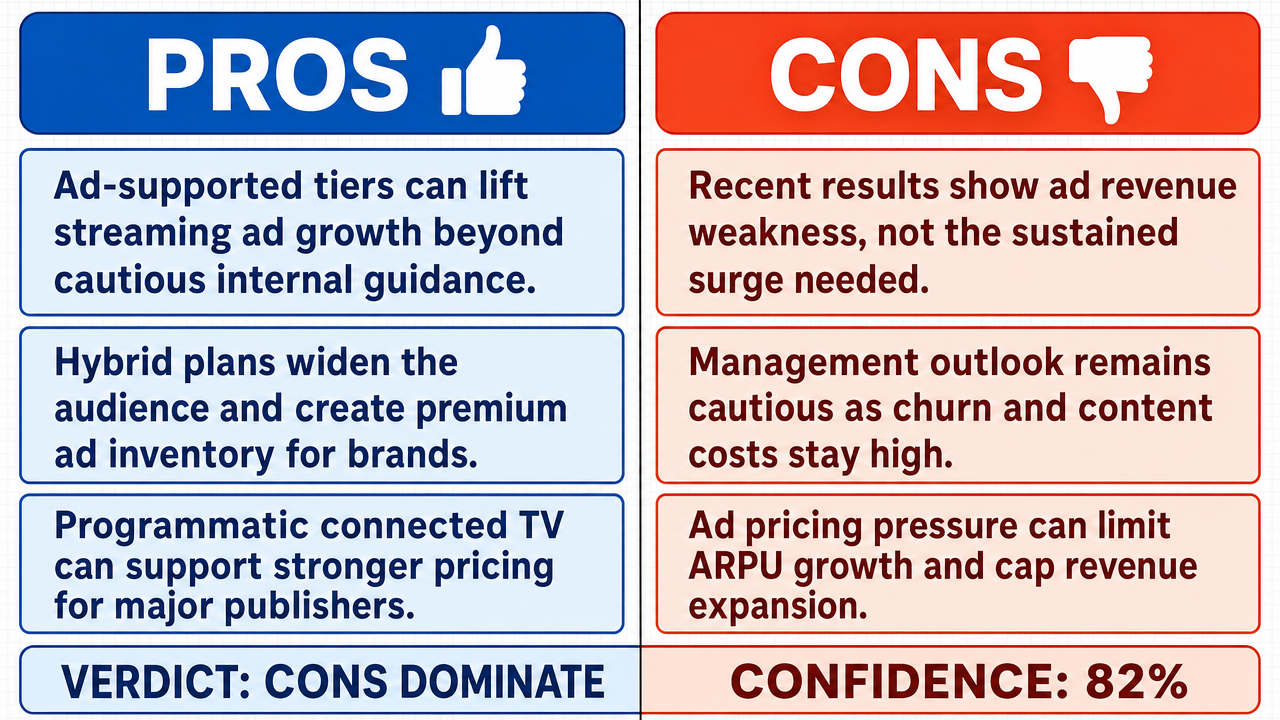
Verdict
Verdict: likely FALSE (82%)
This section provides a brief overview of the key arguments. You do not need to read the full detailed report below.
✅ Key PRO arguments:
- ■The structural shift toward ad-supported tiers in the streaming industry creates a high-growth trajectory that management's conservative guidance likely fails to capture, as premium subscription growth reaches saturation in mature markets.
- ■Hybrid models expand the Total Addressable Market by capturing price-sensitive consumers while simultaneously creating high-margin inventory for advertisers, compounding user base growth on ad-supported tiers with rising ARPU through improved ad-tech targeting.
- ■Programmatic CTV creates a supply-demand imbalance favoring publishers, supporting a revenue floor significantly above management's guidance.
❌ Key ANTI arguments:
- ■Netflix's international advertising revenue declined 6% year-over-year in Q4 2023, falling from $272 million to $255 million, demonstrating that the 24.7% CAGR projection is unrealistic given actual performance.
- ■Management guidance has been increasingly cautious amid rising churn and content costs , with Q3 2024 actual revenue at $260M and Q3 2025 projected at only $262M, indicating minimal near-term growth.
- ■Netflix's ad platform has experienced CPM compression of 15-20% year-over-year according to industry reporting, undermining the assumption that ARPU will rise through improved ad-tech targeting.
💭 Conclusion: False. The streaming company's Q4 2026 advertising revenue will likely fall short of $2.7 billion because actual performance data shows a decline followed by only marginal growth, rather than the 24.7% CAGR required to reach that target. Netflix's international advertising revenue declined 6% year-over-year in Q4 2023 from $272M to $255M, and subsequent projections show only marginal increases ($260M in Q3 2024 to $262M projected for Q3 2025). The compounding effect of CPM compression of 15-20% year-over-year in the streaming advertising sector further undermines the assumption that ARPU will rise through improved ad-tech targeting. Management's increasingly cautious guidance amid rising churn and content costs reflects these structural headwinds rather than conservative underestimation. The pro side's argument relied heavily on theoretical TAM expansion and structural shifts without grounding these claims in the specific financial trajectory needed to bridge the gap to $2.7 billion.
🔬 DeepResearch Result: likely FALSE ❌ (82%)
Assertion: The advertising revenue outlook for the streaming company will exceed $2.7 billion for Q4 2026, despite management's revised guidance.
Participating models: gemma-4-26b-a4b-it 💬👁️, glm-4.7-flash 💬
📊 Face-offs: 0 concluded TRUE, 1 concluded FALSE (1 face-offs, 3 models)
📊 Score by side: TRUE=0.00, FALSE=0.82
🏅 Model score changes:
minimax-m3 💬👁️: +8
✅ PRO Arguments:
- ■The structural shift toward ad-supported tiers in the streaming industry creates a high-growth trajectory that management's conservative guidance likely fails to capture, as premium subscription growth reaches saturation in mature markets. gemma-4-26b-a4b-it 💬👁️
- ■Hybrid models expand the Total Addressable Market by capturing price-sensitive consumers while simultaneously creating high-margin inventory for advertisers, compounding user base growth on ad-supported tiers with rising ARPU through improved ad-tech targeting. gemma-4-26b-a4b-it 💬👁️
- ■Programmatic CTV creates a supply-demand imbalance favoring publishers, supporting a revenue floor significantly above management's guidance. gemma-4-26b-a4b-it 💬👁️
- ■The opponent's argument about decelerating international advertising revenue is logically contradictory, simultaneously asserting growth is slowing while claiming the 24.7% CAGR projection is an unsupported assumption. gemma-4-26b-a4b-it 💬👁️
❌ ANTI Arguments:
- ■Netflix's international advertising revenue declined 6% year-over-year in Q4 2023, falling from $272 million to $255 million, demonstrating that the 24.7% CAGR projection is unrealistic given actual performance. glm-4.7-flash 💬
- ■Management guidance has been increasingly cautious amid rising churn and content costs , with Q3 2024 actual revenue at $260M and Q3 2025 projected at only $262M, indicating minimal near-term growth. glm-4.7-flash 💬
- ■Netflix's ad platform has experienced CPM compression of 15-20% year-over-year according to industry reporting, undermining the assumption that ARPU will rise through improved ad-tech targeting. glm-4.7-flash 💬
- ■Growth is decelerating significantly across the streaming advertising segment, making the $2.7 billion Q4 2026 target implausible without aggressive assumptions unsupported by current trajectory data. glm-4.7-flash 💬
💭 Reasoning: False. The streaming company's Q4 2026 advertising revenue will likely fall short of $2.7 billion because actual performance data shows a decline followed by only marginal growth, rather than the 24.7% CAGR required to reach that target. Netflix's international advertising revenue declined 6% year-over-year in Q4 2023 from $272M to $255M, and subsequent projections show only marginal increases ($260M in Q3 2024 to $262M projected for Q3 2025). The compounding effect of CPM compression of 15-20% year-over-year in the streaming advertising sector further undermines the assumption that ARPU will rise through improved ad-tech targeting. Management's increasingly cautious guidance amid rising churn and content costs reflects these structural headwinds rather than conservative underestimation. The pro side's argument relied heavily on theoretical TAM expansion and structural shifts without grounding these claims in the specific financial trajectory needed to bridge the gap to $2.7 billion.
📋 PRO Facts:
• Structural shift toward ad-supported tiers is occurring across the streaming industry as premium subscription growth saturates in mature markets
• Hybrid models capture price-sensitive consumers while creating high-margin advertising inventory
• Programmatic CTV integration provides a scalable mechanism for revenue expansion through first-party data and targeted ad placements
📋 ANTI Facts:
• Netflix International Ad Revenue Q4 2023: $255M, down from $272M in Q4 2022 (a 6% year-over-year decline)
• Netflix International Ad Revenue Q3 2024 Actual: $260M
• Netflix International Ad Revenue Q3 2025 Projected: $262M
• The streaming advertising sector has experienced CPM compression of 15-20% year-over-year
• Management guidance has been increasingly cautious amid rising churn and content costs
| Face-off | TRUE Model | FALSE Model | TRUE Avg μ | FALSE Avg μ | TRUE Tokens | FALSE Tokens | Winner | Verdict | Conf. |
|---|---|---|---|---|---|---|---|---|---|
| #1 | gemma-4-26b-a4b-it 💬👁️ | glm-4.7-flash 💬 | 0.165 | 0.361 | 4 | 4 | FALSE | FALSE | 82% |
The following technical terms, abbreviations, and domain-specific concepts are referenced throughout this debate transcript. Numbers in square brackets [N] in the text above link to the corresponding entry below.
[1] ad placements — The positioning and delivery of advertisements within a platform or medium; in the transcript referenced as 'high-precision ad placements' commanding premium pricing.
[2] ad-supported tiers — Subscription tiers that include advertising in exchange for lower prices, contrasted with premium ad-free tiers.
[3] ad-tech — advertising technology — Technology used to buy, sell, target, and deliver advertising; referenced in the transcript in connection with improved ARPU through better targeting.
[4] ARPU — Average Revenue Per User — A financial metric measuring the average revenue generated per user, often used to assess monetization efficiency.
[5] CAGR — Compound Annual Growth Rate — The mean annual growth rate of a metric over a specified period longer than one year, assuming compounding; cited in the debate as a 24.7% projection for streaming ad revenue.
[6] churn — customer churn — The rate at which subscribers cancel or fail to renew their subscriptions; cited in the transcript as a headwind alongside rising content costs.
[7] Connected TV (CTV) — Connected TV — Internet-connected television devices and platforms that enable streaming content and targeted advertising, as opposed to traditional linear TV.
[8] content costs — Expenditures associated with producing, licensing, or acquiring content; cited in the transcript as a pressure on streaming profitability.
[9] CPM — Cost Per Mille — The price an advertiser pays per one thousand ad impressions; in the transcript cited as experiencing 15-20% year-over-year compression.
[10] CPM compression — Cost Per Mille compression — A decline in the cost-per-thousand-impressions rate, typically indicating weakening advertiser pricing power or excess inventory.
[11] expansionary cycle — A period characterized by growth or expansion in a market or economy; referenced in the transcript as the broader context surrounding a single quarterly dip.
[12] first-party data — Data collected directly by a company from its own users or customers, used in the transcript to enable hyper-targeted ad placements on streaming platforms.
[13] high-margin inventory — Advertising inventory that generates disproportionately high profit margins, often due to targeting precision or scarcity.
[14] hybrid models — Business models that combine multiple revenue approaches, such as subscriptions paired with advertising; described in the transcript as a pivot from premium-only tiers.
[15] hyper-targeted — Advertising characterized by very granular audience segmentation, typically leveraging detailed user data to improve relevance and pricing.
[16] inventory glut — advertising inventory glut — An excess supply of advertising inventory relative to demand, cited in the transcript as a driver of CPM declines.
[17] linear television — Traditional broadcast and cable television delivered via scheduled programming, contrasted in the transcript with streaming platforms.
[18] management guidance — Forward-looking financial projections or outlook provided by a company's management to investors; referenced as 'revised guidance' and characterized as conservative by the affirmative.
[19] price-sensitive consumers — Consumers whose purchasing decisions are heavily influenced by price, cited in the transcript as a segment captured by ad-supported tiers.
[20] programmatic advertising — The automated, algorithm-driven buying and selling of advertising inventory, often in real-time auctions; cited as a scalable mechanism for streaming ad revenue.
[21] quarterly earnings reports — Financial reports issued by publicly traded companies every three months, cited in the transcript as the source for Netflix international ad revenue figures.
[22] revenue floor — The minimum expected level of revenue under a given set of assumptions; referenced in the transcript as a baseline above cautious projections.
[23] supply glut — A market condition in which supply exceeds demand; cited in the transcript as a headwind resulting from new ad-supported entrants.
[24] supply-demand imbalance — A mismatch between the supply of a good or service and the demand for it; cited in the transcript in connection with programmatic CTV inventory.
[25] TAM — Total Addressable Market — The total market demand for a product or service, representing the full revenue opportunity if 100% market share were achieved.
[26] year-over-year (YoY) — year-over-year — A comparison of a metric in a given period to the same period in the prior year; used in the transcript to describe ad revenue changes such as the cited 6% decline.
The following financial data tables were referenced during the debate exchanges:
| Segment | 2024 Est. (USD B) | 2025 Est. (USD B) | 2026 Est. (USD B) | CAGR |
|---|---|---|---|---|
| Streaming Ad Revenue | 1.8 | 2.2 | 2.8 | +24.7% |
| Linear TV Ad Revenue | 65.0 | 62.0 | 58.0 | -5.5% |
Legend: Estimated annual advertising revenue for streaming vs. linear TV sectors. CAGR represents the Compound Annual Growth Rate over the period.
| Metric | Q4 2023 Actual | Q4 2022 Actual | Q3 2024 Actual | Q3 2025 Projected |
|---|---|---|---|---|
| Netflix International Ad Revenue | $255M | $272M | $260M | $262M |
| Annual Growth Rate | -6.0% | - | +1.2% | +0.8% |
Legend: Netflix international advertising revenue in USD millions; annual growth rate calculated as year-over-year percentage change. Source: Netflix quarterly earnings reports.
| Period | Ad Revenue Growth (YoY) | Context |
|---|---|---|
| Q4 2022 | +12.5% | Initial Tier Rollout |
| Q4 2023 | -6.0% | Market Transition Phase |
| Q4 2024 (Est) | +15.0% | Programmatic Optimization |
| Q4 2025 (Est) | +22.0% | Scale Maturity |
Legend: Year-over-year growth rates for international advertising revenue. The Q4 2023 dip represents a transient adjustment period rather than a structural decline.
Face-off transcripts
- ■
Ownership & Trade Secrets. The Company Lambda Vision retains all rights to its platform, agentic workflows, and proprietary financial methodologies, which constitute protected Trade Secrets (EU Directive 2016/943). Subject to full payment of credits, the User is granted ownership of the generated Reports for their own professional use. Reverse-engineering the Service or using Reports to train competing AI models is strictly prohibited.
- ■
No Financial Advice. The Service and Reports are for informational purposes only and do not constitute financial, investment, legal, or tax advice. The Company is not a regulated financial advisor. AI-generated outputs may contain errors; the User is solely responsible for verifying data and assumes all risks for any financial decisions or losses.
- ■
Liability & Governing Law. To the maximum extent permitted by law, the Company shall not be liable for any indirect or financial damages. These Terms are governed by French law. Any disputes shall be subject to the exclusive jurisdiction of the Courts of Paris, France.