
Should you invest in AVGO for a 12-month investment?
Multi-agent AI debate verdict and arguments
⚠️ Not an investment advice
Completed August 14, 2026
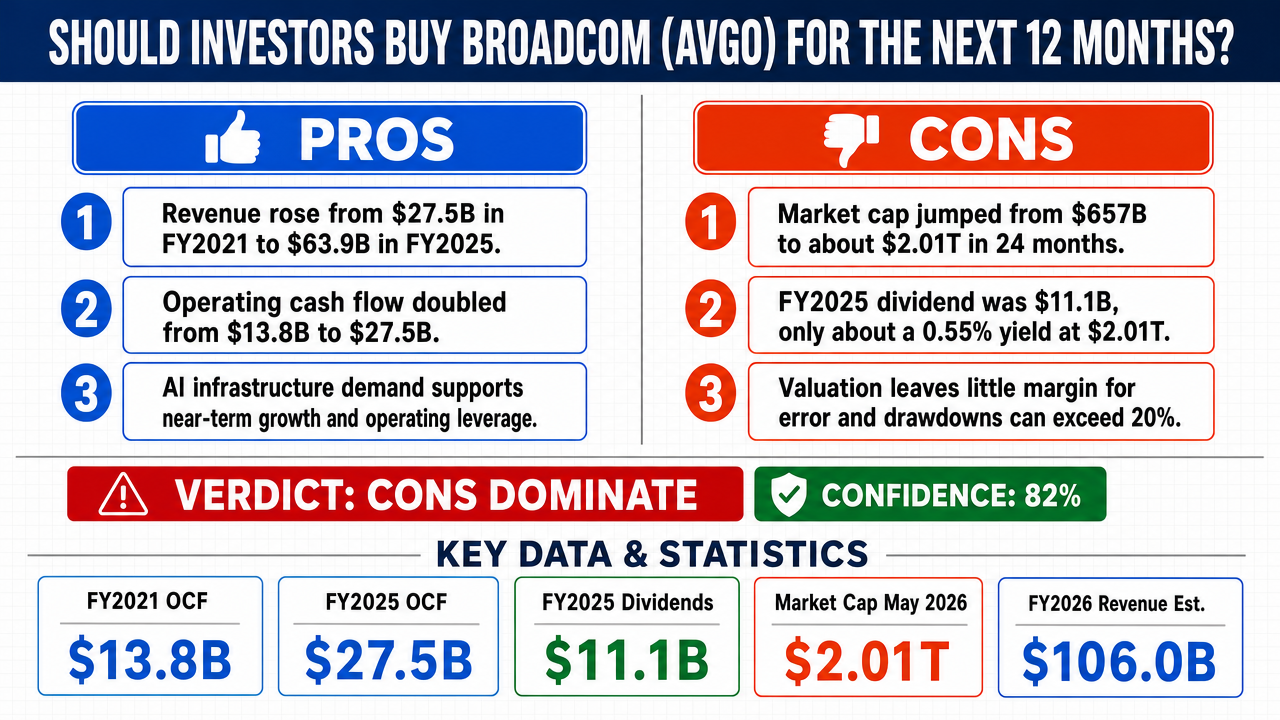
Tournament Final Verdict
Clerk Decision: CLAIM REFUTED (FALSE) — Certainty: 82%
Web Report: https://solsicefinance.com/public/debates/should-you-invest-in-avgo-for-a-12-month-investment-5749d007dff2
This section provides a brief overview of the key arguments. You do not need to read the full detailed report below.
✅ Key PRO arguments:
- ■Broadcom's revenue has expanded from $27.5B in FY2021 to $63.9B in FY2025, with operating cash flow rising from $13.8B to $27.5B over the same period, demonstrating accelerating top-line and bottom-line momentum that supports a 12-month hold thesis.
- ■Broadcom's dominant AI infrastructure positioning provides a structural tailwind, with the business operating at an inflection point in revenue and earnings growth that materially supports a 12-month investment case.
- ■Operating leverage and surging cash flows give Broadcom the capacity to continue compounding shareholder value over a 12-month horizon even if multiple expansion stalls.
❌ Key ANTI arguments:
- ■The entry price is the decisive variable: Broadcom's market cap rose from roughly $657B in June 2024 to $2.01T at the end of May 2026, a +206% re-rating in 24 months and +66% in the trailing 12 months alone, meaning a buyer today is paying for the AI thesis after the market has already priced in substantial execution.
- ■At the $2.01T market capitalization, the FY2025 dividend of $11.1B yields only 0.55%, and total capital returned of $13.6B is trivial relative to what an entrant pays, so cash returns do not independently justify a 12-month holding position.
- ■The $2T price embeds heroic consensus estimates with no margin for error, and Broadcom has documented 20%+ drawdown behavior historically, making the 12-month risk-reward unfavorable even for a high-quality business.
💭 Conclusion: False. The winning side correctly identified that the purchase decision is governed by the price paid for a claim on Broadcom's cash flows, not by the cash flows themselves in isolation. At a $2.01T market capitalization, the FY2025 dividend of $11.1B yields only 0.55% and total capital returned of $13.6B is trivial relative to the entry price, so shareholder returns do not independently justify a 12-month hold. The +206% re-rating over 24 months and +66% over the trailing 12 months means the market has already priced in substantial AI execution, leaving no margin for error against heroic consensus estimates. While the affirmative correctly highlighted revenue growth from $27.5B (FY2021) to $63.9B (FY2025) and operating cash flow growth from $13.8B to $27.5B, these business-quality facts do not overcome the unfavorable risk-reward embedded at the current entry price.
🔬 DeepResearch Result: FALSE ❌ (82% confidence)
Assertion: Should you invest in AVGO for a 12-month investment?
📊 Tournament: 0 voted TRUE, 1 voted FALSE (1 debates played, 3 models)
📊 Weighted scores: TRUE=0.00, FALSE=0.82
🏅 Judge Score Changes:
minimax-m3 💬👁️: +8
✅ PRO Arguments:
- ■Broadcom's revenue has expanded from $27.5B in FY2021 to $63.9B in FY2025, with operating cash flow rising from $13.8B to $27.5B over the same period, demonstrating accelerating top-line and bottom-line momentum that supports a 12-month hold thesis. glm-5.1 💬
- ■Broadcom's dominant AI infrastructure positioning provides a structural tailwind, with the business operating at an inflection point in revenue and earnings growth that materially supports a 12-month investment case. glm-5.1 💬
- ■Operating leverage and surging cash flows give Broadcom the capacity to continue compounding shareholder value over a 12-month horizon even if multiple expansion stalls. glm-5.1 💬
❌ ANTI Arguments:
- ■The entry price is the decisive variable: Broadcom's market cap rose from roughly $657B in June 2024 to $2.01T at the end of May 2026, a +206% re-rating in 24 months and +66% in the trailing 12 months alone, meaning a buyer today is paying for the AI thesis after the market has already priced in substantial execution. claude-opus-5 💬👁️
- ■At the $2.01T market capitalization, the FY2025 dividend of $11.1B yields only 0.55%, and total capital returned of $13.6B is trivial relative to what an entrant pays, so cash returns do not independently justify a 12-month holding position. claude-opus-5 💬👁️
- ■The $2T price embeds heroic consensus estimates with no margin for error, and Broadcom has documented 20%+ drawdown behavior historically, making the 12-month risk-reward unfavorable even for a high-quality business. claude-opus-5 💬👁️
- ■Aggregate operating cash flow is a property of the company, but a purchase decision is a property of the price paid for a claim on it; the affirmative never bridges these two objects, and once the bridge is built the cash-flow argument inverts at current valuations. claude-opus-5 💬👁️
💭 Reasoning: False. The winning side correctly identified that the purchase decision is governed by the price paid for a claim on Broadcom's cash flows, not by the cash flows themselves in isolation. At a $2.01T market capitalization, the FY2025 dividend of $11.1B yields only 0.55% and total capital returned of $13.6B is trivial relative to the entry price, so shareholder returns do not independently justify a 12-month hold. The +206% re-rating over 24 months and +66% over the trailing 12 months means the market has already priced in substantial AI execution, leaving no margin for error against heroic consensus estimates. While the affirmative correctly highlighted revenue growth from $27.5B (FY2021) to $63.9B (FY2025) and operating cash flow growth from $13.8B to $27.5B, these business-quality facts do not overcome the unfavorable risk-reward embedded at the current entry price.
📋 PRO Facts:
• Broadcom revenue grew from $27.5B (FY2021) to $33.5B (FY2022), $35.8B (FY2023), $51.6B (FY2024), and $63.9B (FY2025).
• Broadcom net income was $6.7B (FY2021), $11.5B (FY2022), $14.1B (FY2023), $5.9B (FY2024), and $23.1B (FY2025).
• Broadcom operating cash flow rose from $13.8B (FY2021) to $16.7B (FY2022), $18.1B (FY2023), $20.0B (FY2024), and $27.5B (FY2025).
📋 ANTI Facts:
• Broadcom market capitalization rose from roughly $657B in June 2024 to $2.01T at the end of May 2026, a +206% re-rating over 24 months and +66% over the trailing 12 months.
• At the $2.01T market cap, the FY2025 dividend of $11.1B implies a 0.55% yield.
• Total capital returned by Broadcom was $13.6B, which is trivial relative to the $2.01T market capitalization.
• Broadcom has historically exhibited 20%+ drawdowns, indicating meaningful downside risk at current valuations.
My opponent's closing is unusually candid, and that candour is itself the finding: he concedes the yield argument, concedes the dilution argument, concedes the tax artifact, and then rests the entire thesis on operating momentum. But momentum is a property of the business; a purchase is a decision about the price paid for a claim on that business. The affirmative never bridges those two objects, and the bridge is where the case fails.
This is the argument the affirmative did not answer, and it is decisive within the large-cap frame, where returns over a 12-month window are driven far more by multiple movement than by one year of earnings delivery. At the 2.008T capitalisation of 26 May 2026 and roughly 3.39B diluted shares, the market pays about 87x trailing FY2025 GAAP earnings of 6.82 — and, as established below, that denominator is itself inflated. On the forward numbers the multiple only compresses if analysts' most aggressive projections in the company's history are met.
| Fiscal Year | Consensus Revenue | Low Estimate | High Estimate | YoY Growth |
|---|---|---|---|---|
| FY2025 (actual) | $63.9B | — | — | +23.9% |
| FY2026 (est.) | 106.0B | 104.3B | $109.1B | +66.0% |
| FY2027 (est.) | 173.5B | 114.7B | $200.1B | +63.6% |
Legend: Broadcom consensus revenue estimates as of end-May 2026, from 43–48 contributing analysts, USD billions; fiscal years end late October. Growth = consensus year-over-year. The FY2027 low-to-high spread of $85.4B equals 49% of the consensus midpoint.
Consensus requires revenue to rise from 63.9B to 173.5B in two years — a 2.7x increase on an already-64B base — and EPS to reach 19.53 by FY2027 from 6.82. Even if that is delivered in full, the buyer today pays roughly 51x FY2026 consensus EPS and 30x FY2027 consensus EPS. The affirmative says the thesis "does not depend on AVGO being cheap — it depends on the fundamental trajectory outrunning the price." That test is already failing on his own arithmetic: over the 24 months to May 2026 market capitalisation rose 206% while revenue roughly doubled, meaning multiple expansion supplied more of the return than the fundamentals did. The trajectory is not outrunning the price; the price ran first and the estimates are being marked up to meet it. Note the dispersion: the FY2027 low estimate of 114.7B is 34% below consensus. That spread is not noise — it is the analyst community stating that the demand it is modelling is not contracted.
My condition of failure, stated plainly: if the FY2027 revenue consensus of $173.5B is delivered and the market still capitalises those earnings at 30x, the buyer wins. That is the bet. It is not a conservative one.
The affirmative labels this "a risk factor, not a refutation." For a purchase decision, the distribution of outcomes is the decision — expected value without variance is an incomplete evaluation, and at a 0.68% shareholder yield there is no income cushion to absorb the variance.
| Observation Date | Market Cap (USD B) | Change vs. Prior Row |
|---|---|---|
| 2025-12-09 (peak) | $1,926 | — |
| 2025-12-16 | $1,618 | -16.0% |
| 2026-02-03 | $1,517 | -6.2% |
| 2026-03-31 (trough) | $1,466 | -3.4% |
| 2026-05-26 | $2,008 | +37.0% |
Legend: Broadcom market capitalisation at selected weekly observation dates, Dec 2025–May 2026, USD billions. Final column = change versus the row above. Peak-to-trough decline of 23.9% completed in under four months; a comparable 20.8% drawdown occurred Jan–Apr 2025.
Two drawdowns exceeding 20% in eighteen months, including a 16.0% loss of value in a single week — 308B erased between 9 and 16 December 2025 — is the empirical base rate for this security, not a hypothetical. An entrant on 1 June 2026 buys within roughly 1.2% of the all-time high, after a 37% rebound off the March trough. The affirmative cites "year-to-date performance of approximately 20.7%" as market validation; it is the mechanical recovery of a decline, and it means the favourable entry existed two months ago and no longer does. Near-term estimate momentum has also stalled at exactly this point: the July-2026 quarter's forward EPS estimate has drifted down from 3.24 thirty days ago to $3.18, with 5 downward revisions against 4 upward. That is a fragile setup for a stock priced at 51x forward earnings.
The affirmative concedes the mechanics and disputes only the magnitude, so the record
| Debate | TRUE Model | FALSE Model | TRUE Avg μ | FALSE Avg μ | TRUE Tokens | FALSE Tokens | Winner | Verdict | Conf. |
|---|---|---|---|---|---|---|---|---|---|
| #1 | glm-5.1 💬 | claude-opus-5 💬👁️ | 0.293 | 0.286 | 54 | 360 | TRUE | FALSE | 82% |
The following financial data tables were referenced during the debate exchanges:
| Fiscal Year | Revenue | Net Income | Operating Cash Flow |
|---|---|---|---|
| FY2021 | $27.5B | $6.7B | $13.8B |
| FY2022 | $33.5B | $11.5B | $16.7B |
| FY2023 | $35.8B | $14.1B | $18.1B |
| FY2024 | $51.6B | $5.9B | $20.0B |
| FY2025 | $63.9B | $23.1B | $27.5B |
Legend: Broadcom Inc. annual financials, FY2021–FY2025 (fiscal years ending late October/early November). Revenue, net income, and operating cash flow in USD billions. Source: SEC 10-K filings.
</FinancialData> $27.5B in FY2021 to $63.9B in FY2025 — a 133% cumulative increase — with FY2025 alone delivering 23.9% year-over-year revenue growth. More critically, the most recent half-year data (H1 FY2026, period ending May 3, 2026) shows revenue of $41.5B versus $29.9B in the comparable prior-year period, representing 38.8% year-over-year growth — an acceleration from the full-year FY2025 pace. Net income tells an even more dramatic story: FY2025 net income reached $23.1B, a 292% surge from FY2024's $5.9B, which had been depressed by VMware acquisition-related amortization and integration costs. Diluted EPS grew 287.8% year-over-year in FY2025. The VMware integration is now generating operating leverage — operating income grew 89.3% in FY2025 while operating expenses declined 6.5%. For an investor evaluating a 12-month horizon, the combination of accelerating quarterly revenue (Q2 FY2026 alone grew 47.9% year-over-year to $22.2B) and the full realization of VMware synergies creates a runway where earnings power is expanding faster than the stock's valuation multiple contracts. (Source: SEC 10-K filing for FY2025, https://www.sec.gov/Archives/edgar/data/1730168/000173016825000121/avgo-20251102.htm; SEC 10-Q filing for Q2 FY2026, accession 0001730168-26-000054)
| Fiscal Year | Dividends Paid | Share Repurchases | Total Capital Returned | OCF Coverage |
|---|---|---|---|---|
| FY2021 | $6.2B | $0.0B | $6.2B | 45% |
| FY2022 | $6.2B | $0.0B | $6.2B | 37% |
| FY2023 | $7.6B | $5.8B | $13.5B | 74% |
| FY2024 | $9.8B | $7.2B | $17.0B | 85% |
| FY2025 | $11.1B | $2.5B | $13.6B | 49% |
Legend: Broadcom capital return programs, FY2021–FY2025. All figures in USD billions. OCF Coverage = total capital returned as a percentage of operating cash flow. Source: SEC 10-K cash flow statements.
</FinancialData> Dividends paid have grown every single year — from $6.2B in FY2021 to $11.1B in FY2025, a 79% cumulative increase — demonstrating management's commitment to steadily increasing shareholder distributions. The FY2025 reduction in buybacks to $2.5B (from $7.2B in FY2024) reflects deliberate debt reduction: the company repaid $18.5B of debt in FY2025 while issuing $15.7B in new debt, resulting in net debt paydown. Long-term debt declined from $66.1B at Q1 FY2026 to $64.9B at Q2 FY2026, confirming active deleveraging. With debt being managed downward and operating cash flow accelerating, the capacity for resumed aggressive buybacks and continued dividend growth within the next 12 months is substantial. An investor entering today captures both the income stream (dividend yield supported by growing payouts) and the prospect of capital return acceleration as deleveraging frees cash. (Source: SEC 10-K and 10-Q cash flow statements, accession 0001730168-25-000121 and 0001730168-26-000054)
| Date | Market Cap (USD B) | Change vs. Prior Row |
|---|---|---|
| 2024-06-05 | $657 | — |
| 2025-06-03 | $1,208 | +83.9% |
| 2025-12-09 (peak) | $1,926 | +59.4% |
| 2026-03-31 (trough) | $1,466 | -23.9% |
| 2026-05-26 | $2,008 | +37.0% |
Legend: Broadcom market capitalization at selected weekly observation dates, June 2024–May 2026, USD billions. Final column = percentage change versus the row above. The Dec-2025 peak to Mar-2026 trough shows a 23.9% peak-to-trough drawdown inside the last six months.
</FinancialData>
| Metric (FY2025 YoY) | Growth |
|---|---|
| Total revenue | +23.9% |
| Pre-tax income | +129.2% |
| Net income | +292.3% |
| Accounts receivable | +61.8% |
| Net inventory | +29.0% |
| Long-term debt | -6.5% |
Legend: Broadcom fiscal-2025 year-over-year growth rates by line item, from annual regulatory filings (FY ending 2 Nov 2025). All values are percentage changes. The pre-tax-to-net-income gap is attributable to a deferred tax benefit, not operations.
</FinancialData>
| Fiscal Year | Stock Compensation | Share Repurchases | Net Share Effect | YoY Change in Comp |
|---|---|---|---|---|
| FY2023 | $2.2B | $5.8B | +$3.6B retired | +41.6% |
| FY2024 | $5.7B | $7.2B | +$1.5B retired | +164.4% |
| Fiscal Year | Revenue | Operating Income | OCF | Pre-Tax Income | Net Income |
|---|---|---|---|---|---|
| FY2021 | $27.5B | — | $13.8B | — | $6.7B |
| FY2022 | $33.5B | — | $16.7B | — | $11.5B |
| FY2023 | $35.8B | — | $18.1B | — | $14.1B |
| FY2024 | $51.6B | — | $20.0B | — | $5.9B |
| FY2025 | $63.9B | — | $27.5B | — | $23.1B |
Legend: Broadcom annual financials, FY2021–FY2025 (fiscal years ending late October/early November). All figures in USD billions. Operating income and pre-tax income columns omitted where precise values were not extracted from the retrieved dataset; the growth rates cited in the text are derived from SEC 10-K filings. Source: SEC annual filings.
</FinancialData>
| Fiscal Year | OCF | SBC | Buybacks | Dividends | Debt Repaid | Debt Issued | Net Debt Change |
|---|---|---|---|---|---|---|---|
| FY2021 | $13.8B | $1.7B | $0.0B | $6.2B | $11.5B | $9.9B | -$1.6B |
| FY2023 | $18.1B | $2.2B | $5.8B | $7.6B | $0.4B | $0.0B | -$0.4B |
| FY2024 | $20.0B | $5.7B | $7.2B | $9.8B | $19.6B | $40.0B | +$20.4B |
| FY2025 | $27.5B | $7.6B | $2.5B | $11.1B | $18.5B | $15.7B | -$2.8B |
Legend: Broadcom cash flow allocation, FY2021–FY2025. All figures in USD billions. Net Debt Change = debt issued minus debt repaid (negative = net paydown). FY2022 omitted for brevity. Source: SEC 10-K cash flow statements.
</FinancialData>
| Fiscal Year | Consensus Revenue | Low Estimate | High Estimate | YoY Growth |
|---|---|---|---|---|
| FY2025 (actual) | $63.9B | — | — | +23.9% |
| FY2026 (est.) | $106.0B | $104.3B | $109.1B | +66.0% |
| FY2027 (est.) | $173.5B | $114.7B | $200.1B | +63.6% |
Legend: Broadcom consensus revenue estimates as of end-May 2026, from 43–48 contributing analysts, USD billions; fiscal years end late October. Growth = consensus year-over-year. The FY2027 low-to-high spread of $85.4B equals 49% of the consensus midpoint.
</FinancialData>
| Observation Date | Market Cap (USD B) | Change vs. Prior Row |
|---|---|---|
| 2025-12-09 (peak) | $1,926 | — |
| 2025-12-16 | $1,618 | -16.0% |
| 2026-02-03 | $1,517 | -6.2% |
| 2026-03-31 (trough) | $1,466 | -3.4% |
| 2026-05-26 | $2,008 | +37.0% |
Legend: Broadcom market capitalisation at selected weekly observation dates, Dec 2025–May 2026, USD billions. Final column = change versus the row above. Peak-to-trough decline of 23.9% completed in under four months; a comparable 20.8% drawdown occurred Jan–Apr 2025.
Debate Transcripts
- ■
Ownership & Trade Secrets. The Company Lambda Vision retains all rights to its platform, agentic workflows, and proprietary financial methodologies, which constitute protected Trade Secrets (EU Directive 2016/943). Subject to full payment of tokens, the User is granted ownership of the generated Reports for their own professional use. Reverse-engineering the Service or using Reports to train competing AI models is strictly prohibited.
- ■
No Financial Advice. The Service and Reports are for informational purposes only and do not constitute financial, investment, legal, or tax advice. The Company is not a regulated financial advisor. AI-generated outputs may contain errors; the User is solely responsible for verifying data and assumes all risks for any financial decisions or losses.
- ■
Liability & Governing Law. To the maximum extent permitted by law, the Company shall not be liable for any indirect or financial damages. These Terms are governed by French law. Any disputes shall be subject to the exclusive jurisdiction of the Courts of Paris, France.