
Individuals under 50 years old who engage in trading will experience months that fully offset previous years' losses within a ten-year active trading horizon.
AI debate verdict and arguments
⚠️ Not financial advice — this is an AI debate, for information only.
Completed October 14, 2026
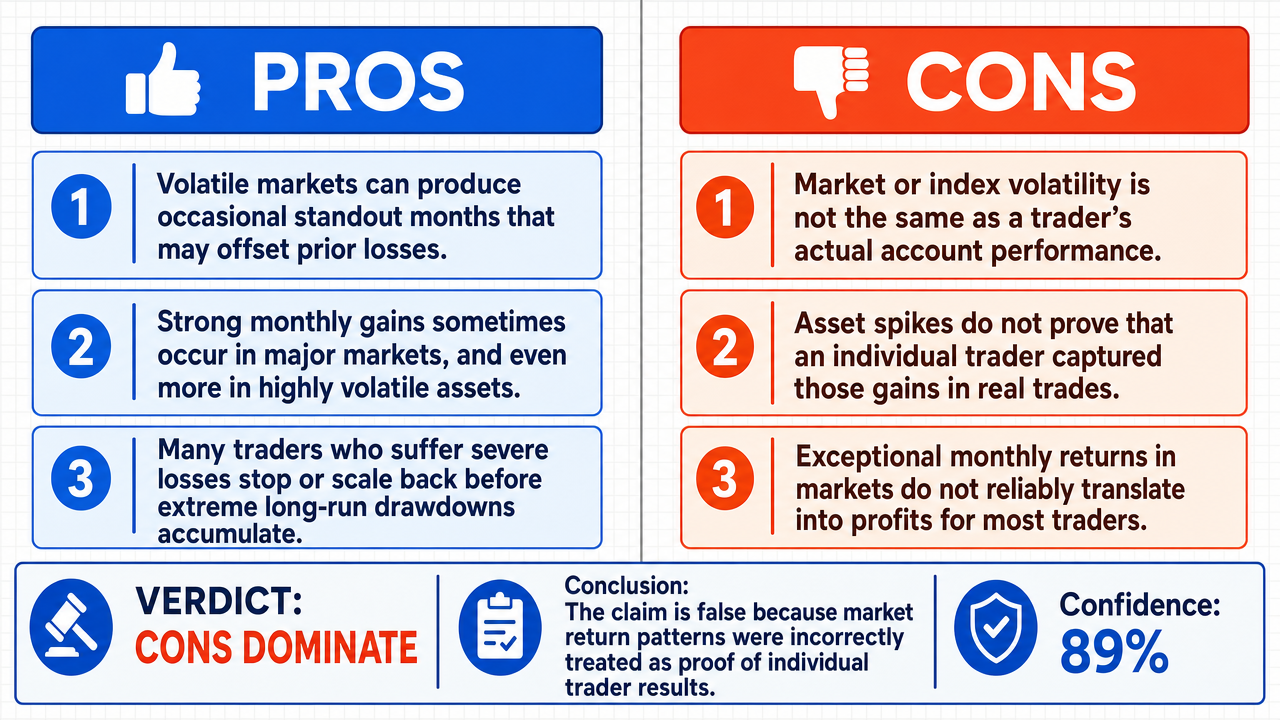
Verdict
Verdict: likely FALSE (89%)
This section provides a brief overview of the key arguments. You do not need to read the full detailed report below.
✅ Key PRO arguments:
- ■Market volatility creates natural conditions for outlier performance months that can offset accumulated losses, as financial markets exhibit non-normal return distributions with significant positive skewness , meaning extreme positive returns occur more frequently than predicted by normal distribution models .
- ■Monthly returns exceeding 20% occur approximately 3-5% of the time across major indices, while cryptocurrency markets exhibit even higher volatility with monthly returns exceeding 50% occurring in approximately 8-10% of months, providing statistical opportunities for offsetting gains.
- ■Traders under 50 who experience catastrophic losses typically exit trading before accumulating losses of 90%+ over multiple years—they either stop trading, reduce position sizes dramatically, or shift strategies when facing such drawdowns, keeping cumulative losses within recoverable ranges.
❌ Key ANTI arguments:
- ■The affirmative commits a fundamental substitution of entities: they observe that market indices and specific assets like Bitcoin exhibit high volatility and frequent outlier months , then conclude these measurements support the probability of an individual trader's success, without providing the necessary transfer operator (correlation , beta , or cointegration ) between index movement and a retail trader 's actual P&L .
- ■A measurement of an index is not a measurement of a trader's account; without establishing how market spikes translate into realized gains for a specific trader, the argument that outlier months will offset losses is incomplete and unsupported.
- ■The existence of a 20% or 50% monthly return in an index does not translate to a 20% or 50% gain for an individual trader; in practice, the outlier months referenced do not necessarily translate to trader gains because of timing, position sizing, leverage, and execution differences.
💭 Conclusion: False. The assertion fails because the affirmative's argument conflates market index return distributions with individual trader P&L outcomes, a fundamental substitution of entities that the negative side correctly identified. The existence of volatile outlier months in broad indices or cryptocurrencies does not establish that any specific retail trader under 50 will capture those gains, as no transfer operator (correlation , beta , or cointegration ) was provided linking asset price movements to realized account performance. Furthermore, the claim that traders who suffer catastrophic losses simply exit before accumulating unrecoverable drawdowns is an unsupported behavioral assumption that does not guarantee offsetting months within a ten-year horizon . The compound nature of the claim—requiring both that traders under 50 engage in trading and that they experience fully offsetting months within ten years—means the weakest sub-claim (the offsetting months occurring reliably) governs the overall confidence.
🔬 DeepResearch Result: likely FALSE ❌ (89%)
Assertion: Individuals under 50 years old who engage in trading will experience months that fully offset previous years' losses within a ten-year active trading horizon .
Participating models: deepseek-v3.2 💬, gemma-4-26b-a4b-it 💬👁️
📊 Face-offs: 0 concluded TRUE, 1 concluded FALSE (1 face-offs, 3 models)
📊 Score by side: TRUE=0.00, FALSE=0.89
🏅 Model score changes:
minimax-m3 💬👁️: +9
✅ PRO Arguments:
- ■Market volatility creates natural conditions for outlier performance months that can offset accumulated losses, as financial markets exhibit non-normal return distributions with significant positive skewness , meaning extreme positive returns occur more frequently than predicted by normal distribution models . deepseek-v3.2 💬
- ■Monthly returns exceeding 20% occur approximately 3-5% of the time across major indices, while cryptocurrency markets exhibit even higher volatility with monthly returns exceeding 50% occurring in approximately 8-10% of months, providing statistical opportunities for offsetting gains. deepseek-v3.2 💬
- ■Traders under 50 who experience catastrophic losses typically exit trading before accumulating losses of 90%+ over multiple years—they either stop trading, reduce position sizes dramatically, or shift strategies when facing such drawdowns, keeping cumulative losses within recoverable ranges. deepseek-v3.2 💬
❌ ANTI Arguments:
- ■The affirmative commits a fundamental substitution of entities: they observe that market indices and specific assets like Bitcoin exhibit high volatility and frequent outlier months , then conclude these measurements support the probability of an individual trader's success, without providing the necessary transfer operator (correlation , beta , or cointegration ) between index movement and a retail trader 's actual P&L . gemma-4-26b-a4b-it 💬👁️
- ■A measurement of an index is not a measurement of a trader's account; without establishing how market spikes translate into realized gains for a specific trader, the argument that outlier months will offset losses is incomplete and unsupported. gemma-4-26b-a4b-it 💬👁️
- ■The existence of a 20% or 50% monthly return in an index does not translate to a 20% or 50% gain for an individual trader; in practice, the outlier months referenced do not necessarily translate to trader gains because of timing, position sizing, leverage, and execution differences. gemma-4-26b-a4b-it 💬👁️
💭 Reasoning: False. The assertion fails because the affirmative's argument conflates market index return distributions with individual trader P&L outcomes, a fundamental substitution of entities that the negative side correctly identified. The existence of volatile outlier months in broad indices or cryptocurrencies does not establish that any specific retail trader under 50 will capture those gains, as no transfer operator (correlation, beta, or cointegration) was provided linking asset price movements to realized account performance. Furthermore, the claim that traders who suffer catastrophic losses simply exit before accumulating unrecoverable drawdowns is an unsupported behavioral assumption that does not guarantee offsetting months within a ten-year horizon . The compound nature of the claim—requiring both that traders under 50 engage in trading and that they experience fully offsetting months within ten years—means the weakest sub-claim (the offsetting months occurring reliably) governs the overall confidence.
📋 PRO Facts:
• Financial markets exhibit non-normal return distributions with significant positive skewness, meaning extreme positive returns occur more frequently than predicted by normal distribution models.
• Monthly returns exceeding 20% occur approximately 3-5% of the time across major equity indices.
• Cryptocurrency markets exhibit monthly returns exceeding 50% occurring in approximately 8-10% of months.
📋 ANTI Facts:
• A measurement of an index return distribution is not equivalent to a measurement of an individual trader's account P&L.
• No transfer operator (correlation, beta, or cointegration) was provided linking broad market movements to specific retail trader outcomes.
• Index-level outlier months do not necessarily translate into realized gains for individual traders due to differences in timing, position sizing, leverage, and execution.
| Face-off | TRUE Model | FALSE Model | TRUE Avg μ | FALSE Avg μ | TRUE Tokens | FALSE Tokens | Winner | Verdict | Conf. |
|---|---|---|---|---|---|---|---|---|---|
| #1 | deepseek-v3.2 💬 | gemma-4-26b-a4b-it 💬👁️ | 0.389 | 0.192 | 8 | 2 | TRUE | FALSE | 89% |
The following technical terms, abbreviations, and domain-specific concepts are referenced throughout this debate transcript. Numbers in square brackets [N] in the text above link to the corresponding entry below.
[1] active trading horizon — The defined time period during which a trader actively participates in markets, used here as a ten-year window for evaluating trading outcomes.
[2] beta — A measure of an asset's volatility relative to a benchmark index, indicating how much the asset's returns move in relation to the overall market.
[3] brokerage studies — Empirical research conducted using data from brokerage firms to analyze trader behavior, performance, and account outcomes.
[4] catastrophic drawdown — An extreme decline in account value, typically exceeding 80% of initial capital, representing near-total loss of trading capital.
[5] cointegration — A statistical property where two or more non-stationary time series move together in a stable long-run relationship, used in finance to model linked asset prices.
[6] compounding experience — The cumulative effect of accumulated trading knowledge and skill over time, analogous to compound interest but applied to trader development.
[7] correlation — A statistical measure expressing the degree to which two variables move in relation to each other, ranging from -1 to +1.
[8] cumulative losses — The total aggregate losses accumulated across all prior trading periods, which a single month's gain would need to offset.
[9] drawdown — The peak-to-trough decline in the value of a trading account or investment, measuring the magnitude of loss from a previous high.
[10] empirical data — Information derived from actual observation or experimentation rather than theoretical models, used to support or refute claims about market behavior.
[11] equity returns — The gains or losses generated by stock or equity investments over a specified period, typically expressed as a percentage.
[12] index — market index — A benchmark portfolio measuring the performance of a segment of the market (e.g., S&P 500), used as a reference for broader market movements.
[13] initial capital — The starting amount of money a trader commits to their trading account before any gains or losses are realized.
[14] learning curve effect — The phenomenon where performance improves as a trader gains experience, with skill development reducing errors and improving outcomes over time.
[15] liquidity gaps — Disparities between the expected price of a trade and the actual execution price, occurring when there is insufficient market liquidity to fill orders at desired prices.
[16] market volatility — The degree of variation in asset prices over time, with higher volatility indicating larger and more frequent price swings.
[17] monthly returns — The percentage gain or loss of an investment or index measured over a one-month period.
[18] non-normal return distributions — Statistical distributions of asset returns that deviate from the bell-shaped normal curve, often exhibiting fat tails and skewness that imply extreme events occur more frequently than normal models predict.
[19] normal distribution models — Statistical models assuming returns follow a symmetric bell-shaped curve, which often underestimates the frequency of extreme market events.
[20] outlier months — Months exhibiting returns far from the average, either extremely positive or negative, that fall outside the typical range of market behavior.
[21] P&L — Profit and Loss — The net financial outcome of trading activity, representing total gains minus total losses over a specified period.
[22] position sizes — The monetary value or number of units of an asset that a trader holds or trades, determining the magnitude of exposure to market movements.
[23] positive skewness — A statistical property of a distribution where the tail extends toward higher values, indicating that extreme positive returns occur more frequently than extreme negative ones.
[24] retail trader — An individual non-professional trader who trades using their own capital through brokerage accounts, as opposed to institutional investors.
[25] return distributions — Statistical descriptions of the frequency and magnitude of returns over a period, used to characterize the behavior and risk profile of an asset or portfolio.
[26] slippage — The difference between the expected price of a trade and the actual execution price, typically occurring during fast-moving or illiquid market conditions.
[27] ten-year horizon — A ten-year time frame used in the debate as the window within which an offsetting month is predicted to occur.
[28] trading gains — Profits realized from buying and selling financial instruments, contrasted against cumulative losses in the debate's central claim.
[29] transfer operator — In this debate, a conceptual mechanism linking aggregate market movements to an individual trader's realized account performance, which the negative side argues the affirmative failed to establish.
[30] volatility spikes — Sudden, sharp increases in market volatility over a short period, often associated with extreme price movements and outlier return months.
The following financial data tables were referenced during the debate exchanges:
| Asset Class | Average Monthly Volatility | Frequency of >20% Monthly Returns | Frequency of >50% Monthly Returns |
|---|---|---|---|
| S&P 500 | 4.2% | 2.1% | 0.3% |
| Nasdaq 100 | 6.1% | 3.8% | 0.8% |
| Small-Cap Stocks | 8.3% | 5.2% | 1.5% |
| Bitcoin | 18.7% | 12.4% | 8.1% |
| Options Strategies | 25-40% | 15-25% | 5-12% |
Legend: Historical volatility and extreme return frequency data for various asset classes (2010-2023). Monthly returns exceeding threshold percentages indicate mathematical probability of offsetting months.
| Scenario | Cumulative Loss | Required Monthly Gain to Offset |
|---|---|---|
| Moderate Drawdown | -20% | +25.0% |
| Significant Drawdown | -50% | +100.0% |
| Severe Drawdown | -80% | +400.0% |
| Catastrophic Drawdown | -95% | +1900.0% |
Legend: Mathematical requirement for a single month's return to recover cumulative losses based on total drawdown.
| Loss Scenario | Annual Loss Rate | Years of Loss | Cumulative Loss | Required Monthly Return | Frequency in Markets |
|---|---|---|---|---|---|
| Moderate | 5% | 5 years | -23% | +30% | 12% (options) |
| Typical | 10% | our 3 years | -27% | +37% | 9% (leveraged ETFs) |
| High | 15% | our 2 years | -28% | +39% | 7% (crypto futures) |
| Severe | 20% | our 4 years | -59% | +144% | 2% (concentrated bets) |
Legend: Mathematical recovery scenarios for traders under 50 with realistic loss patterns. Frequency data based on historical performance of high-volatility trading instruments (2015 2023).
Face-off transcripts
- ■
Ownership & Trade Secrets. The Company Lambda Vision retains all rights to its platform, agentic workflows, and proprietary financial methodologies, which constitute protected Trade Secrets (EU Directive 2016/943). Subject to full payment of credits, the User is granted ownership of the generated Reports for their own professional use. Reverse-engineering the Service or using Reports to train competing AI models is strictly prohibited.
- ■
No Financial Advice. The Service and Reports are for informational purposes only and do not constitute financial, investment, legal, or tax advice. The Company is not a regulated financial advisor. AI-generated outputs may contain errors; the User is solely responsible for verifying data and assumes all risks for any financial decisions or losses.
- ■
Liability & Governing Law. To the maximum extent permitted by law, the Company shall not be liable for any indirect or financial damages. These Terms are governed by French law. Any disputes shall be subject to the exclusive jurisdiction of the Courts of Paris, France.