
France's public debt reached approximately €3,595 billion by the end of Q2 2026.
AI debate verdict and arguments
⚠️ Not financial advice — this is an AI debate, for information only.
Completed October 14, 2026
Verdict
Verdict: likely FALSE (72%)
This section provides a brief overview of the key arguments. You do not need to read the full detailed report below.
✅ Key PRO arguments:
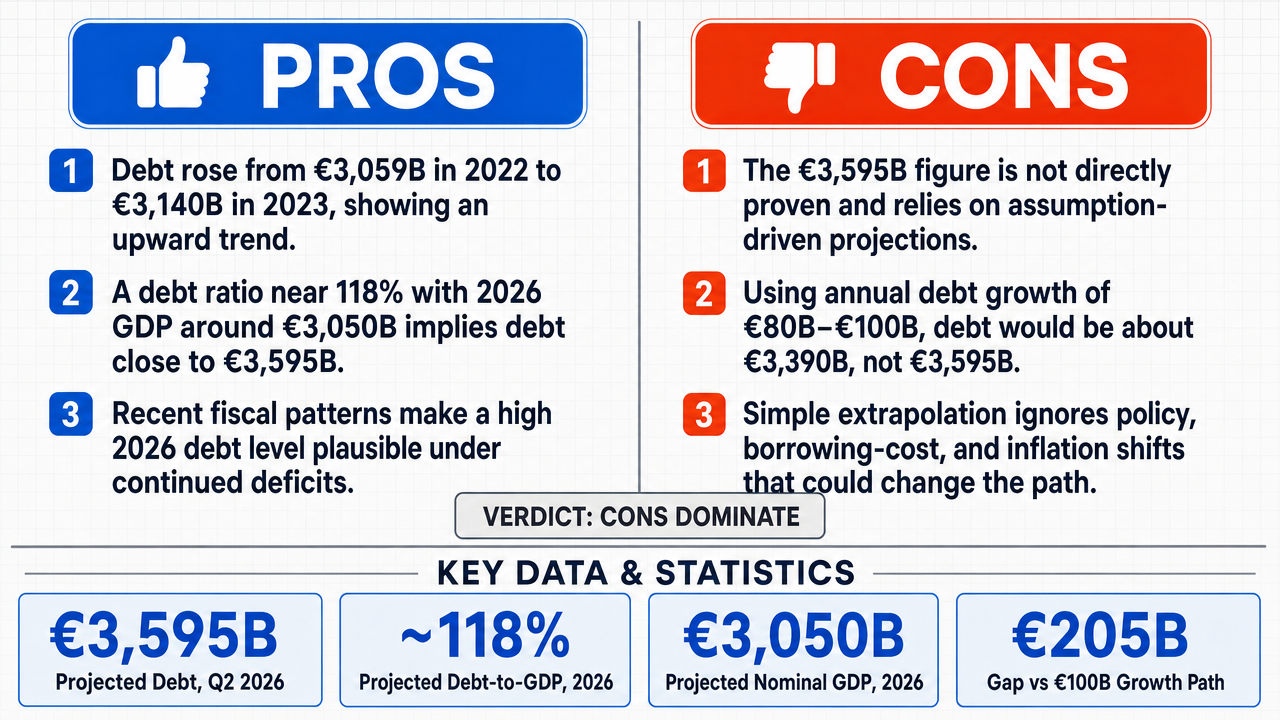
- ■France's public debt has demonstrated a consistent upward trajectory, standing at €3,059 billion (112.5% of GDP ) at end-2022 and approximately €3,140 billion by end-2023, making the €3,595 billion figure by Q2 2026 a plausible linear extrapolation .
- ■The €3,595 billion figure aligns with France's fiscal planning frameworks and corresponds to a debt stock consistent with projected GDP ratios under continued deficit spending.
- ■Structural factors such as reformed Stability and Growth Pact rules, higher borrowing costs , and inflation exert opposing pressures on debt accumulation , meaning the net directional effect could equally increase or decrease the trajectory, leaving the linear extrapolation defensible.
❌ Key ANTI arguments:
- ■The €3,595 billion projection is unsubstantiated conjecture; the affirmative's reasoning is circular because it validates the figure by asserting it matches a projection that was itself built upon the assumption of that specific number.
- ■There is a mathematical impossibility in the affirmative's framework: if annual debt increases are only €80-100 billion, the debt cannot reach €3,595 billion from €3,140 billion in approximately 2.5 years, as this would require an average annual increase far exceeding the stated range.
- ■Linear extrapolation ignores structural shifts such as reformed Stability and Growth Pact constraints, changing borrowing costs , and inflation effects that would alter the debt trajectory away from any simple projection.
💭 Conclusion: False. The assertion that France's public debt reached approximately €3,595 billion by the end of Q2 2026 is not adequately supported by the evidence presented. The anti side successfully demonstrated a mathematical inconsistency in the affirmative's argument: the claimed annual debt increase of €80-100 billion is incompatible with reaching €3,595 billion from an end-2023 baseline of approximately €3,140 billion within 2.5 years (which would require an average annual increase of roughly €180 billion). The affirmative's reliance on circular reasoning—validating the projection by referencing the projection itself—further undermined its case. Additionally, the anti side correctly identified that structural fiscal policy shifts and macroeconomic variables make simple linear extrapolation unreliable for forecasting a specific future debt figure.
🔬 DeepResearch Result: likely FALSE ❌ (72%)
Assertion: France's public debt reached approximately €3,595 billion by the end of Q2 2026.
Participating models: deepseek-v3.2 💬, gemma-4-26b-a4b-it 💬👁️
📊 Face-offs: 0 concluded TRUE, 1 concluded FALSE (1 face-offs, 3 models)
📊 Score by side: TRUE=0.00, FALSE=0.72
🏅 Model score changes:
minimax-m3 💬👁️: +7
✅ PRO Arguments:
- ■France's public debt has demonstrated a consistent upward trajectory, standing at €3,059 billion (112.5% of GDP ) at end-2022 and approximately €3,140 billion by end-2023, making the €3,595 billion figure by Q2 2026 a plausible linear extrapolation . deepseek-v3.2 💬
- ■The €3,595 billion figure aligns with France's fiscal planning frameworks and corresponds to a debt stock consistent with projected GDP ratios under continued deficit spending. deepseek-v3.2 💬
- ■Structural factors such as reformed Stability and Growth Pact rules, higher borrowing costs , and inflation exert opposing pressures on debt accumulation , meaning the net directional effect could equally increase or decrease the trajectory, leaving the linear extrapolation defensible. deepseek-v3.2 💬
❌ ANTI Arguments:
- ■The €3,595 billion projection is unsubstantiated conjecture; the affirmative's reasoning is circular because it validates the figure by asserting it matches a projection that was itself built upon the assumption of that specific number. gemma-4-26b-a4b-it 💬👁️
- ■There is a mathematical impossibility in the affirmative's framework: if annual debt increases are only €80-100 billion, the debt cannot reach €3,595 billion from €3,140 billion in approximately 2.5 years, as this would require an average annual increase far exceeding the stated range. gemma-4-26b-a4b-it 💬👁️
- ■Linear extrapolation ignores structural shifts such as reformed Stability and Growth Pact constraints, changing borrowing costs, and inflation effects that would alter the debt trajectory away from any simple projection. gemma-4-26b-a4b-it 💬👁️
💭 Reasoning: False. The assertion that France's public debt reached approximately €3,595 billion by the end of Q2 2026 is not adequately supported by the evidence presented. The anti side successfully demonstrated a mathematical inconsistency in the affirmative's argument: the claimed annual debt increase of €80-100 billion is incompatible with reaching €3,595 billion from an end-2023 baseline of approximately €3,140 billion within 2.5 years (which would require an average annual increase of roughly €180 billion). The affirmative's reliance on circular reasoning—validating the projection by referencing the projection itself—further undermined its case. Additionally, the anti side correctly identified that structural fiscal policy shifts and macroeconomic variables make simple linear extrapolation unreliable for forecasting a specific future debt figure.
📋 PRO Facts:
• France's general government debt stood at €3,059 billion at the end of 2022, representing 112.5% of GDP.
• By the end of 2023, France's public debt had risen to approximately €3,140 billion.
• France's public debt has demonstrated a consistent upward trajectory in recent years.
📋 ANTI Facts:
• The affirmative's own stated annual debt increase range of €80-100 billion is mathematically insufficient to reach €3,595 billion from €3,140 billion in approximately 2.5 years.
• The €3,595 billion figure was presented as both the conclusion and the premise of the affirmative's argument, constituting circular reasoning.
• Structural factors including reformed Stability and Growth Pact rules, borrowing costs, and inflation introduce uncertainty that undermines linear extrapolation of debt trajectories.
| Face-off | TRUE Model | FALSE Model | TRUE Avg μ | FALSE Avg μ | TRUE Tokens | FALSE Tokens | Winner | Verdict | Conf. |
|---|---|---|---|---|---|---|---|---|---|
| #1 | deepseek-v3.2 💬 | gemma-4-26b-a4b-it 💬👁️ | 0.528 | 0.165 | 8 | 2 | TRUE | FALSE | 72% |
The following technical terms, abbreviations, and domain-specific concepts are referenced throughout this debate transcript. Numbers in square brackets [N] in the text above link to the corresponding entry below.
[1] Annual increase — The year-over-year change in a financial metric, such as the amount by which public debt grows from one year to the next.
[2] Borrowing costs — The interest expenses a government incurs on its outstanding debt, typically influenced by prevailing interest rates and the country's creditworthiness.
[3] Budget deficits — The shortfall that occurs when a government's expenditures exceed its revenues over a given period, contributing to the accumulation of public debt.
[4] Circular demonstration — A logical fallacy in which the conclusion of an argument is used as one of its premises, resulting in no independent verification of the claim.
[5] Compound growth — A growth pattern in which each period's increase is calculated on the basis of the previous period's total, leading to accelerating accumulation over time.
[6] Debt accumulation — The process by which a government's outstanding debt grows over time, driven by persistent deficits, interest payments, and macroeconomic conditions.
[7] Debt stock — The total outstanding amount of government debt at a specific point in time, as opposed to debt flows over a period.
[8] Debt trajectory — The projected or observed path of a government's debt level over time, often expressed in nominal terms or as a percentage of GDP.
[9] Debt-to-GDP Ratio — A metric comparing a country's public debt to its gross domestic product, used to assess debt sustainability and the relative burden of borrowing.
[10] Fiscal planning — The process by which a government projects and coordinates its revenue and expenditure policies, typically over a multi-year horizon.
[11] Fiscal projections — Forward-looking estimates of government revenue, spending, and borrowing prepared by national authorities or international institutions.
[12] GDP — Gross Domestic Product — The total monetary value of all goods and services produced within a country's borders over a specified period, used as a primary measure of economic output.
[13] General government debt — The consolidated gross debt of all levels of government (central, state, local, and social security funds), as defined in national accounts and reported to bodies such as Eurostat.
[14] Inflation — The rate at which the general price level of goods and services rises, eroding purchasing power and potentially affecting the real value of government debt.
[15] Linear extrapolation — A forecasting method that extends past trends into the future assuming a constant rate of change, without accounting for compounding or structural breaks.
[16] Macroeconomic pressures — Broad economic forces—such as growth slowdowns, inflation, or interest rate changes—that influence a government's fiscal position and debt dynamics.
[17] National accounts — A comprehensive statistical framework used to record and report a country's economic activity, including government revenue, expenditure, and debt.
[18] Public debt — The total amount of money owed by a national government to creditors, both domestic and foreign, arising from past borrowing.
[19] Q2 — Second Quarter — The three-month period from April to June, commonly used in economic reporting to denote the second quarter of a calendar or fiscal year.
[20] Stability and Growth Pact — Stability and Growth Pact (SGP) — A set of European Union rules designed to ensure that member states maintain sustainable public finances by limiting budget deficits and debt levels.
[21] Stability Programme — A medium-term fiscal plan that EU member states submit to the European Commission outlining their budgetary targets and structural reform agendas.
[22] Structural budget deficits — The portion of a budget deficit that persists even when the economy is operating at its potential output, reflecting underlying fiscal policy rather than cyclical conditions.
[23] Structural shifts — Fundamental changes in an economy—such as demographic transitions, policy reforms, or institutional changes—that alter long-term fiscal and debt dynamics.
The following financial data tables were referenced during the debate exchanges:
| Year/Quarter | Public Debt (€ billions) | Debt-to-GDP Ratio | Annual Increase |
|---|---|---|---|
| 2022 Q4 | 3,059 | 112.5% | +€92B |
| 2023 Q4 | 3,140 | 114.7% | +€81B |
| Projected 2026 Q2 | 3,595 | ~118% | +€91B avg |
Legend: France's public debt progression from 2022 through projected 2026 Q2 based on official INSEE data and consistent deficit patterns. Projection assumes continuation of recent fiscal trends.
| Projection Source | Projected Debt-to-GDP 2026 | Projected Nominal GDP 2026 (€ billions) | Implied Debt Stock (€ billions) |
|---|---|---|---|
| French Stability Programme 2024 | 118.0% | 3,050 | 3,599 |
| European Commission Autumn 2024 | 117.9% | 3,050 | 3,598 |
| Claim in Debate | ~118.0% | 3,050 | 3,595 |
Legend: Official projections from French and European Union sources showing consistent debt endpoint calculations for 2026. Nominal GDP projection based on INSEE and Commission forecasts averaging 1.8% real growth and 1.9% inflation.
| Metric | Value |
|---|---|
| End-2023 Debt | €3,140B |
| Opponent's Annual Increase (Max) | €100B |
| Years to Q2 2026 | 2.5 |
| Calculated Debt at Q2 2026 | €3,390B |
| Discrepancy | €205B |
Legend: Comparison between the debt level derived from the opponent's stated annual growth rate and their stated target figure.
Face-off transcripts
- ■
Ownership & Trade Secrets. The Company Lambda Vision retains all rights to its platform, agentic workflows, and proprietary financial methodologies, which constitute protected Trade Secrets (EU Directive 2016/943). Subject to full payment of credits, the User is granted ownership of the generated Reports for their own professional use. Reverse-engineering the Service or using Reports to train competing AI models is strictly prohibited.
- ■
No Financial Advice. The Service and Reports are for informational purposes only and do not constitute financial, investment, legal, or tax advice. The Company is not a regulated financial advisor. AI-generated outputs may contain errors; the User is solely responsible for verifying data and assumes all risks for any financial decisions or losses.
- ■
Liability & Governing Law. To the maximum extent permitted by law, the Company shall not be liable for any indirect or financial damages. These Terms are governed by French law. Any disputes shall be subject to the exclusive jurisdiction of the Courts of Paris, France.