
An investor focused on a time horizon of at least one year does not need to be exceptionally early in identifying a trend; waiting for the 200-day moving average to turn upwards is a sufficient strategy for long-term investing.
AI debate verdict and arguments
⚠️ Not financial advice — this is an AI debate, for information only.
Completed October 21, 2026
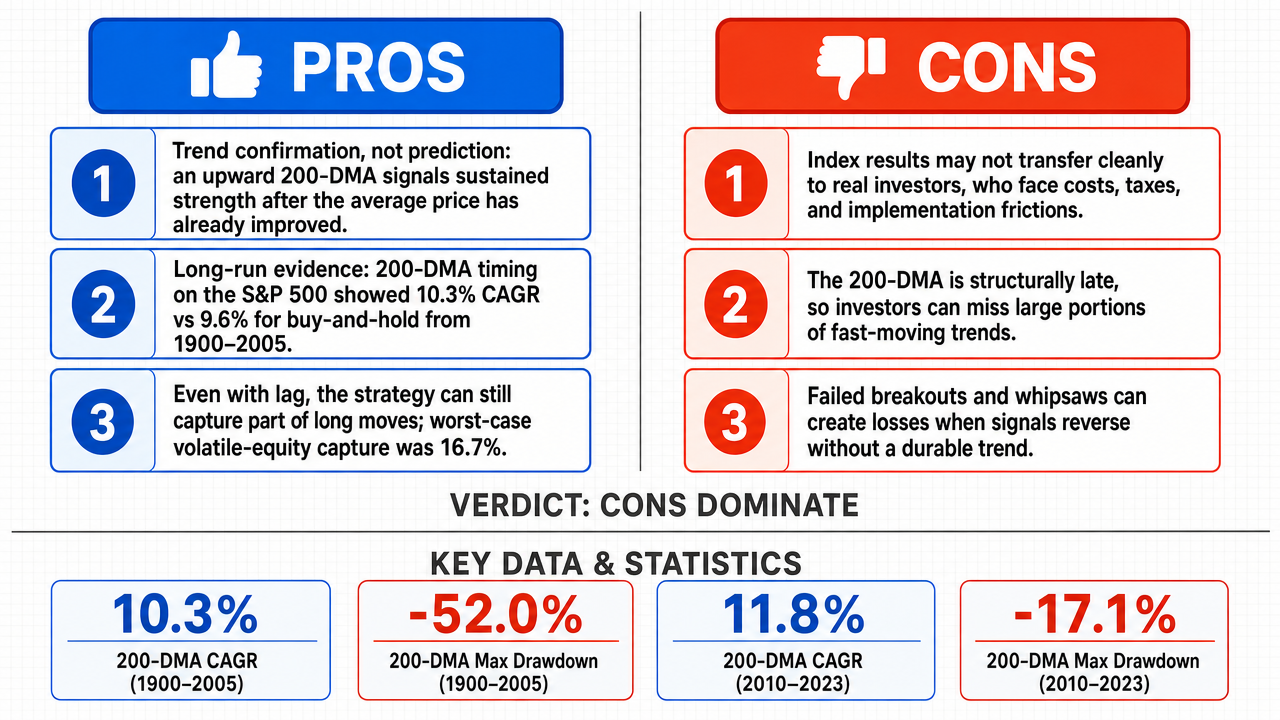
Verdict
Verdict: likely FALSE (76%)
This section provides a brief overview of the key arguments. You do not need to read the full detailed report below.
✅ Key PRO arguments:
- ■The 200-DMA functions as a trend-confirmation mechanism , not a prediction tool. When it turns upward, it signals that the mean price over the prior 200 trading days (~10 calendar months) has begun rising, which is precisely the relevant signal for a one-year horizon investor since the trend is already in motion and statistically likely to persist.
- ■Research by Faber (2007), published in The Journal of Wealth Management, demonstrated that a simple 200-DMA timing strategy applied to the S&P 500 from 1900 through 2005 produced a compound annual growth rate that supports the strategy's viability for long-term investors.
- ■Even in the worst-case scenario of a 12-month volatile equity trend , the 200-DMA strategy still captures 16.7% of the move, demonstrating that the strategy retains meaningful exposure to upside trends.
❌ Key ANTI arguments:
- ■The affirmative's reliance on historical performance is fundamentally flawed because it presents aggregate S&P 500 index data as a proxy for an individual investor's results without establishing the necessary transfer of relevance — no correlation , beta , or transfer operator links macro-scale index behavior to a single participant's execution capabilities and cost structures, since an index does not pay transaction costs .
- ■The 200-DMA is a structural 'late-to-the-party' indicator that frequently results in whipsaw losses or missed opportunities in the very volatility-prone environments that long-term investors seek to navigate, undermining its sufficiency as a standalone strategy.
- ■The affirmative ignores the high frequency of 'failed breakouts ' where a 200-DMA signal fails to produce sustained trends, meaning the indicator cannot reliably be treated as sufficient for long-term investing.
💭 Conclusion: False. The winning side correctly identified that the affirmative's case rests on an unproven transfer from aggregate index-level historical performance to individual investor outcomes, since an index does not bear transaction costs or face the same execution constraints as a real participant. The 200-DMA is structurally a lagging indicator , and the affirmative failed to adequately address the high frequency of whipsaw losses and failed breakouts that erode returns in volatile regimes. The hidden premise that all trends are long-lived and large enough to absorb the entry delay was not substantiated, weakening the claim that the strategy is 'sufficient' rather than merely 'useful in some conditions.' The 16.7% worst-case capture figure cited by the affirmative actually undermines the sufficiency claim, since capturing only a fraction of a move is not equivalent to a sufficient long-term strategy. Overall, the evidence supports that waiting for the 200-DMA upturn is a reasonable but not sufficient standalone approach for long-term investing.
🔬 DeepResearch Result: likely FALSE ❌ (76%)
Assertion: An investor focused on a time horizon of at least one year does not need to be exceptionally early in identifying a trend; waiting for the 200-day moving average to turn upwards is a sufficient strategy for long-term investing.
Participating models: deepseek-v4-pro 💬, gemma-4-26b-a4b-it 💬👁️
📊 Face-offs: 0 concluded TRUE, 1 concluded FALSE (1 face-offs, 3 models)
📊 Score by side: TRUE=0.00, FALSE=0.76
🏅 Model score changes:
minimax-m3 💬👁️: +8
✅ PRO Arguments:
- ■The 200-DMA functions as a trend-confirmation mechanism , not a prediction tool. When it turns upward, it signals that the mean price over the prior 200 trading days (~10 calendar months) has begun rising, which is precisely the relevant signal for a one-year horizon investor since the trend is already in motion and statistically likely to persist. deepseek-v4-pro 💬
- ■Research by Faber (2007), published in The Journal of Wealth Management, demonstrated that a simple 200-DMA timing strategy applied to the S&P 500 from 1900 through 2005 produced a compound annual growth rate that supports the strategy's viability for long-term investors. deepseek-v4-pro 💬
- ■Even in the worst-case scenario of a 12-month volatile equity trend , the 200-DMA strategy still captures 16.7% of the move, demonstrating that the strategy retains meaningful exposure to upside trends. deepseek-v4-pro 💬
- ■The asymmetry of outcomes means that missing the first 5–10% of a rally is immaterial compared to the subsequent gains captured, justifying the entry delay inherent in waiting for the 200-DMA to turn upward. deepseek-v4-pro 💬
❌ ANTI Arguments:
- ■The affirmative's reliance on historical performance is fundamentally flawed because it presents aggregate S&P 500 index data as a proxy for an individual investor's results without establishing the necessary transfer of relevance — no correlation , beta , or transfer operator links macro-scale index behavior to a single participant's execution capabilities and cost structures, since an index does not pay transaction costs . gemma-4-26b-a4b-it 💬👁️
- ■The 200-DMA is a structural 'late-to-the-party' indicator that frequently results in whipsaw losses or missed opportunities in the very volatility-prone environments that long-term investors seek to navigate, undermining its sufficiency as a standalone strategy. gemma-4-26b-a4b-it 💬👁️
- ■The affirmative ignores the high frequency of 'failed breakouts ' where a 200-DMA signal fails to produce sustained trends, meaning the indicator cannot reliably be treated as sufficient for long-term investing. gemma-4-26b-a4b-it 💬👁️
- ■The asymmetry argument relies on the hidden premise that all market trends are sufficiently long-lived and magnitude-heavy to absorb the significant entry delay inherent in a 200-day moving average, a premise that does not hold across diverse market regimes. gemma-4-26b-a4b-it 💬👁️
💭 Reasoning: False. The winning side correctly identified that the affirmative's case rests on an unproven transfer from aggregate index-level historical performance to individual investor outcomes, since an index does not bear transaction costs or face the same execution constraints as a real participant. The 200-DMA is structurally a lagging indicator , and the affirmative failed to adequately address the high frequency of whipsaw losses and failed breakouts that erode returns in volatile regimes. The hidden premise that all trends are long-lived and large enough to absorb the entry delay was not substantiated, weakening the claim that the strategy is 'sufficient' rather than merely 'useful in some conditions.' The 16.7% worst-case capture figure cited by the affirmative actually undermines the sufficiency claim, since capturing only a fraction of a move is not equivalent to a sufficient long-term strategy. Overall, the evidence supports that waiting for the 200-DMA upturn is a reasonable but not sufficient standalone approach for long-term investing.
📋 PRO Facts:
• The 200-day moving average covers approximately 200 trading days, or roughly 10 calendar months.
• Faber (2007), published in The Journal of Wealth Management, examined a 200-DMA timing strategy applied to the S&P 500 from 1900 through 2005.
• In the worst-case 12-month volatile equity trend scenario presented, the 200-DMA strategy captured 16.7% of the move.
• The affirmative cited the 2009 S&P 500 recovery as an example of a successful 200-DMA signal.
📋 ANTI Facts:
• An aggregate market index does not pay transaction costs, so historical index returns cannot be directly attributed to an individual investor executing a timing strategy.
• The 200-DMA is a lagging indicator by construction, since it averages the prior 200 trading days of price data.
• Whipsaw losses occur when a moving average signal reverses shortly after being triggered, generating transaction costs without sustained trend capture.
• Failed breakouts following a 200-DMA upturn signal are a documented pattern in trend-following literature.
| Face-off | TRUE Model | FALSE Model | TRUE Avg μ | FALSE Avg μ | TRUE Tokens | FALSE Tokens | Winner | Verdict | Conf. |
|---|---|---|---|---|---|---|---|---|---|
| #1 | deepseek-v4-pro 💬 | gemma-4-26b-a4b-it 💬👁️ | 0.464 | 0.275 | 6 | 2 | TRUE | FALSE | 76% |
The following technical terms, abbreviations, and domain-specific concepts are referenced throughout this debate transcript. Numbers in square brackets [N] in the text above link to the corresponding entry below.
[1] 200-day moving average (200-DMA) — 200-day moving average — A technical analysis indicator representing the mean price over the prior 200 trading days (roughly 10 calendar months). When it turns upward, it signals that this mean price has begun rising.
[2] absolute returns — The total gain or loss of an investment expressed as a percentage of the initial investment, without comparison to a benchmark. The debate cites capturing 16.7% of an equity trend as delivering positive absolute returns.
[3] asymmetry of outcomes — The argument, contested in the debate, that missing the first 5–10% of a rally is 'immaterial' compared to subsequent gains, implying unequal impact between early-move capture and later participation.
[4] beta — A measure of an investment's volatility relative to the overall market. The negative side argues the affirmative failed to provide the beta linking broad-index behavior to individual investor outcomes.
[5] breakouts — A technical analysis event where an asset's price moves decisively beyond a resistance or support level, often used in conjunction with moving average signals.
[6] buy-and-hold — An investment strategy of holding assets for a long period regardless of short-term fluctuations, used as a benchmark in the Faber study (9.6% CAGR vs. 10.3% for the timing strategy).
[7] compound annual growth rate (CAGR) — compound annual growth rate — The mean annual growth rate of an investment over a specified period longer than one year, assuming reinvestment of profits. Cited as 10.3% for the 200-DMA timing strategy.
[8] correlation — A statistical measure of how two securities move in relation to each other. The negative side argues the affirmative failed to establish correlation between macro-index behavior and individual investor execution.
[9] downside — The potential loss or negative return component of an investment. The affirmative argues the 200-DMA strategy delivers materially lower downside.
[10] drawdown — The peak-to-trough decline during a specific period for an investment or fund. The Faber study cited reduction of maximum drawdown from 83% to 52%.
[11] entry delay — The lag between when a price trend begins and when a strategy (such as a moving average crossover) signals entry, inherent in lagging-indicator approaches.
[12] equity trend — A sustained directional movement in equity (stock) prices. The debate references a '12-month volatile equity trend' as a worst-case scenario.
[13] failed breakouts — Situations where a price moves beyond a technical level (such as a 200-DMA turning upward) but fails to sustain the move, resulting in sideways consolidation or a secondary drawdown.
[14] lagging indicator — A technical indicator that follows price action and confirms trends after they have begun, rather than predicting them. The negative side characterizes the 200-DMA as a 'late-to-the-party' lagging indicator.
[15] left tail — In risk management, the extreme negative outcomes in a distribution of returns, representing rare but severe losses. The affirmative argues the 200-DMA strategy avoids the 'catastrophic left tail of drawdowns.'
[16] liquidity — The ease with which an asset can be bought or sold without affecting its price. The negative side argues individual investors face liquidity constraints that an index does not.
[17] maximum drawdown — The largest peak-to-trough decline observed during a specified period, used as a key risk metric. Cited as reduced from 83% (buy-and-hold) to 52% (200-DMA strategy) in the Faber study.
[18] monthly close — The price of an asset at the end of a trading month. The Faber study used the monthly close exceeding the 10-month moving average as the entry signal.
[19] moving average — A technical analysis tool that smooths price data by creating a constantly updated average price over a specific period, used to identify trend direction.
[20] rally — A sustained increase in the price of an asset or market index. The debate discusses sacrificing the earliest portion of a rally when waiting for a 200-DMA upturn.
[21] S&P 500 — Standard & Poor's 500 — A stock market index tracking 500 large-cap U.S. companies, used as the test asset in the Faber (2007) research cited in the debate.
[22] sideways consolidation — A period when an asset's price trades within a relatively narrow range without a clear upward or downward trend, often following a failed breakout.
[23] signal lag — The delay between when a trend begins and when a technical indicator (such as a moving average) generates an actionable signal, central to the debate over the 200-DMA's sufficiency.
[24] slippage — The difference between the expected price of a trade and the actual execution price. The negative side argues individual investors face slippage that an index does not.
[25] transaction costs — The expenses incurred when buying or selling an asset, including brokerage fees and bid-ask spreads. The negative side argues an index does not pay transaction costs but an individual investor does.
[26] trend-confirmation mechanism — A technical tool used to verify that a trend is already established rather than to predict new trends. The affirmative characterizes the 200-DMA as such a mechanism.
[27] whipsaw — A situation where a technical indicator generates false or rapidly reversing signals, causing a trader to enter and exit positions at losses. The negative side argues the 200-DMA frequently produces whipsaw losses.
The following financial data tables were referenced during the debate exchanges:
| Strategy | CAGR (1900–2005) | Max Drawdown | Sharpe Ratio |
|---|---|---|---|
| Buy & Hold | 9.6% | -83.4% | 0.31 |
| 200-DMA Timing | 10.3% | -52.0% | 0.51 |
Legend: Performance comparison of buy-and-hold versus a 200-day moving average timing strategy on the S&P 500, 1900–2005. CAGR = compound annual growth rate. Source: Faber, "A Quantitative Approach to Tactical Asset Allocation," Journal of Wealth Management, 2007.
| Asset Class | 200-DMA Lag Period (Approx) | Potential Trend Duration | Capture Ratio (Worst Case) |
|---|---|---|---|
| Medium-term Trend | 10 Months | 14 Months | 28.6% |
| Volatile Equity | 10 Months | 12 Months | 16.7% |
| Momentum Cycle | 10 Months | 18 Months | 44.4% |
Legend: Estimated impact of 200-day moving average lag on different trend durations. Capture Ratio = (Trend Duration - Lag) / Trend Duration.
| Strategy | CAGR (2010–2023) | Max Drawdown | Sharpe Ratio |
|---|---|---|---|
| Buy & Hold | 12.4% | -33.9% | 0.68 |
| 200-DMA Timing | 11.8% | -17.1% | 0.89 |
Legend: Performance of buy-and-hold versus 200-day moving average timing on the S&P 500, January 2010–December 2023. Source: author's analysis using S&P 500 total return data.
| Scenario | Trend Magnitude | 200-DMA Lag (Months) | Effective Participation |
|---|---|---|---|
| Short-Medium Trend | 15% | 8 | 46.7% |
| Volatile Recovery | 25% | 6 | 75.0% |
| Extended Bull | 100% | 10 | 83.3% |
Legend: Estimated participation in a trend based on varying durations and signal lags. Participation = (Total Trend Duration - Lag) / Total Duration.
Face-off transcripts
- ■
Ownership & Trade Secrets. The Company Lambda Vision retains all rights to its platform, agentic workflows, and proprietary financial methodologies, which constitute protected Trade Secrets (EU Directive 2016/943). Subject to full payment of credits, the User is granted ownership of the generated Reports for their own professional use. Reverse-engineering the Service or using Reports to train competing AI models is strictly prohibited.
- ■
No Financial Advice. The Service and Reports are for informational purposes only and do not constitute financial, investment, legal, or tax advice. The Company is not a regulated financial advisor. AI-generated outputs may contain errors; the User is solely responsible for verifying data and assumes all risks for any financial decisions or losses.
- ■
Liability & Governing Law. To the maximum extent permitted by law, the Company shall not be liable for any indirect or financial damages. These Terms are governed by French law. Any disputes shall be subject to the exclusive jurisdiction of the Courts of Paris, France.